 Image: NRAO/AUI/NSF (CC BY 4.0)
A galaxy-sized detector made of pulsars
On 29 June 2023 four collaborations on three continents announced, in a coordinated set of papers, evidence for gravitational waves with periods of years to decades. No instrument on Earth can be built to detect waves that slow. The detector was the Galaxy itself: 68 pulsars spread across the Milky Way, timed for 15 years to a precision of a few hundred nanoseconds, and the waves showed up as a pattern in the small delays of their pulses. This article explains how a pulsar timing array works and what was found.
Pulsars as clocks
A pulsar is a neutron star, a star of about 1.4 solar masses squeezed into a sphere 20 kilometres across, that spins and sweeps a beam of radio waves past the Earth once per turn. The first was found by Jocelyn Bell Burnell in 1967. The ones that matter here are the millisecond pulsars, old neutron stars that were spun up by matter falling on them from a companion star and now turn hundreds of times a second. Their spin is so steady that after a model of the spin-down, the orbit, and the Earth's own motion has been fitted, the arrival time of a pulse can be predicted years ahead to within 100 nanoseconds. Some of them keep time as well as the best atomic clocks over a decade.
What remains after the model is subtracted is called the timing residual, a scatter of a few hundred nanoseconds around zero. Anything that changes the travel time of the pulses, from the slow drift of the interstellar gas to an error in the terrestrial time standard, shows up in it. A gravitational wave passing between the pulsar and the Earth does too, because the wave stretches and squeezes the space the pulses cross, so that they arrive a little early and a little late in turn.
How large the effect is
A wave of strain \(h\) and frequency \(f\) shifts the arrival times by roughly \(h/(2\pi f)\). The waves the arrays are looking for have a strain of a few times \(10^{-15}\) at a frequency of one cycle per year, which is \(3.2 \times 10^{-8}\) hertz. The shift is
\[ \delta t \sim \frac{2.4 \times 10^{-15}}{2\pi \times 3.2 \times 10^{-8}\ \mathrm{Hz}} \approx 1.2 \times 10^{-8}\ \mathrm{s}, \]about 12 nanoseconds, which is well below the scatter of a single pulsar. The strain is ten thousand times larger than the \(10^{-21}\) of LIGO's events, but the frequency is a billion times lower, so the delay is small in absolute terms. No single pulsar can show it. The signal is found in the correlations between pulsars, which is where the array comes in.
The Hellings-Downs curve
A background of gravitational waves arriving from every direction affects every pulsar, and the delays of two pulsars are correlated in a way that depends only on the angle between them on the sky. Ronald Hellings and George Downs worked out the pattern in 1983, in a four-page paper. Two pulsars close together on the sky see the same stretching and their delays move together. Two pulsars at right angles are slightly anticorrelated, because a wave that stretches space along one direction squeezes it along the perpendicular one. Two pulsars on opposite sides of the sky are correlated again, but only half as strongly as neighbours. Written with \(x = (1 - \cos\theta)/2\), the correlation for a pair separated by the angle \(\theta\) is
\[ \Gamma(\theta) = \frac{1}{2} + \frac{3}{2}\,x \ln x - \frac{x}{4}, \]which starts at one half, dips below zero near 82 degrees, and ends at one quarter. The shape is fixed by general relativity's two polarizations, and it is the fingerprint of gravitational waves: a clock error at the observatory would delay every pulsar equally, with no angular pattern, and an error in the model of the solar system would produce a dipole on the sky. Only gravitational waves give this particular curve, which is why an array needs many pulsars at many separations rather than one very good one.
The evidence of 2023
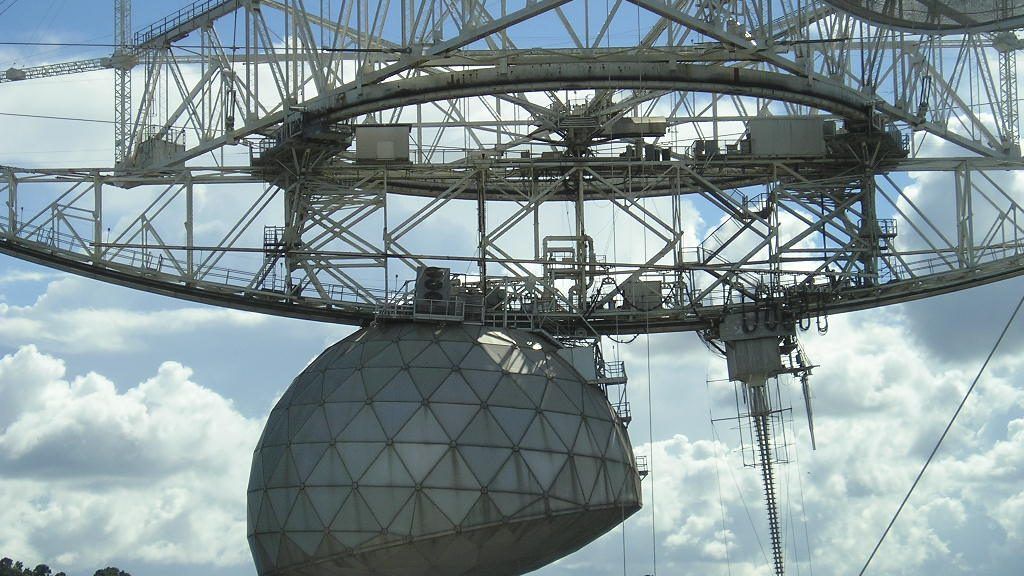
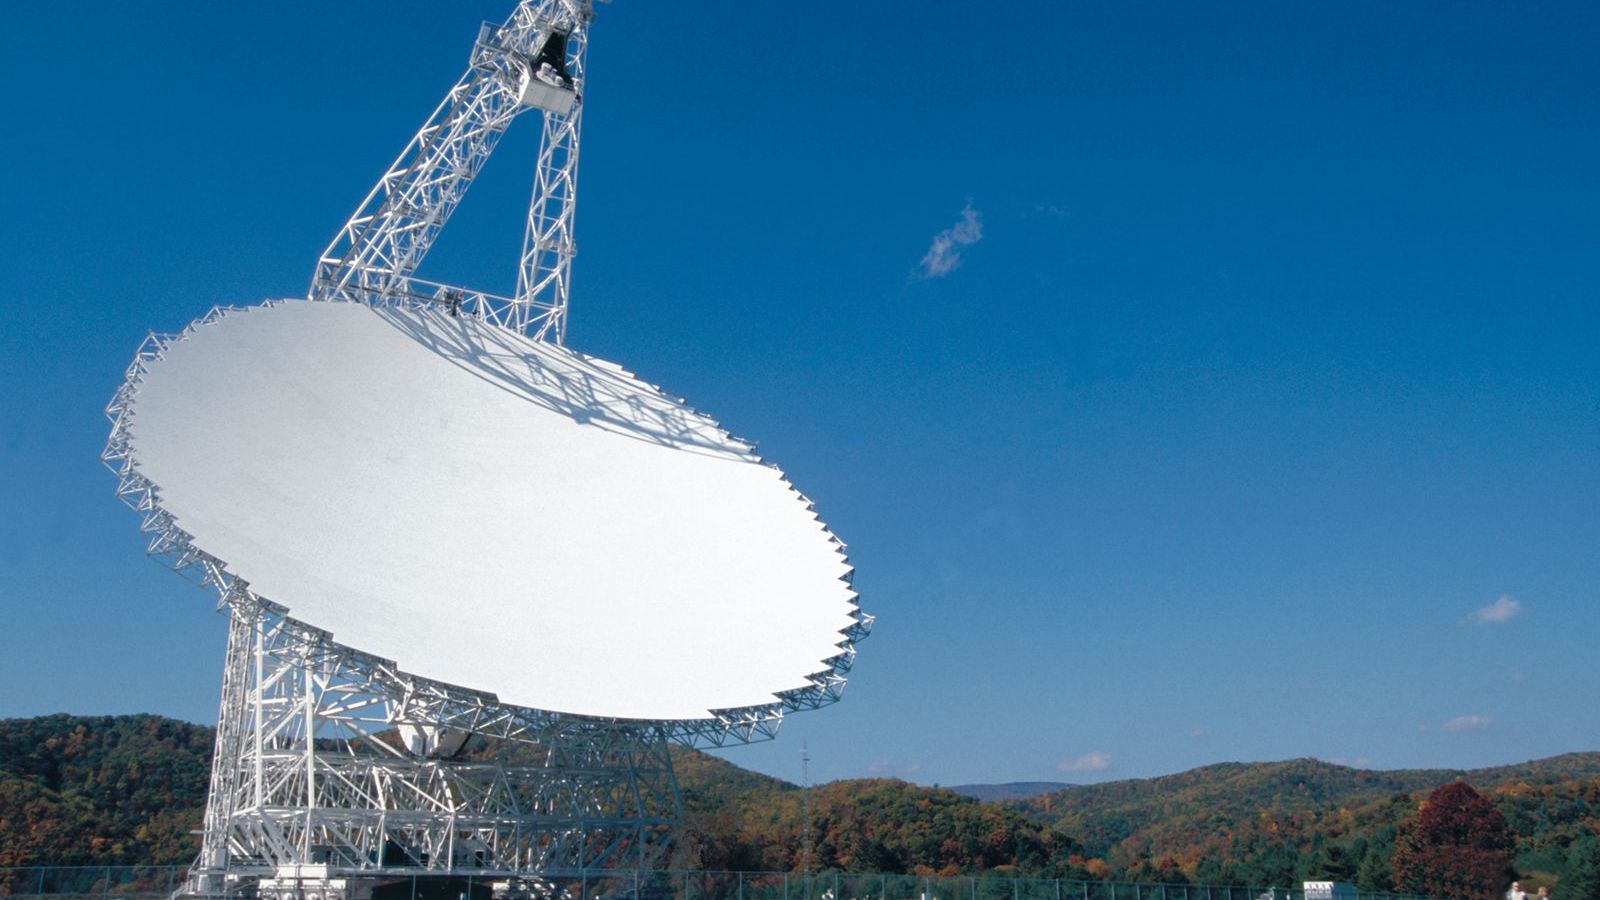
NANOGrav, the North American collaboration, timed 68 millisecond pulsars with the Arecibo, Green Bank, and Very Large Array telescopes over 15 years and used 67 of them in the analysis. The result, in The NANOGrav 15-year Data Set: Evidence for a Gravitational-wave Background, was a common signal in all the pulsars with the spectrum expected of a background, and correlations between pairs that follow the Hellings-Downs curve with a significance of about 3 to 4 standard deviations, depending on how the test is done. The amplitude of the background is \(2.4 \times 10^{-15}\) at one cycle per year, the number used above. The same day the European Pulsar Timing Array with its Indian partners, the Parkes Pulsar Timing Array in Australia, and the Chinese Pulsar Timing Array published consistent results from their own pulsars and telescopes. The NANOGrav summary pages set out the papers and the data, which are public.
The collaborations said evidence, not detection, and the distinction matters. In particle physics and in gravitational-wave astronomy a discovery is claimed at 5 standard deviations, a false-alarm chance of about one in three million; 3 to 4 standard deviations means a chance between about one in a thousand and one in thirty thousand that the pattern arose from noise. The next step is to combine the arrays into the International Pulsar Timing Array, with more pulsars and longer baselines, and the MeerKAT telescope in South Africa has already added a set of pulsars timed to better precision than any before. The curve should sharpen within a few years.
What makes the waves
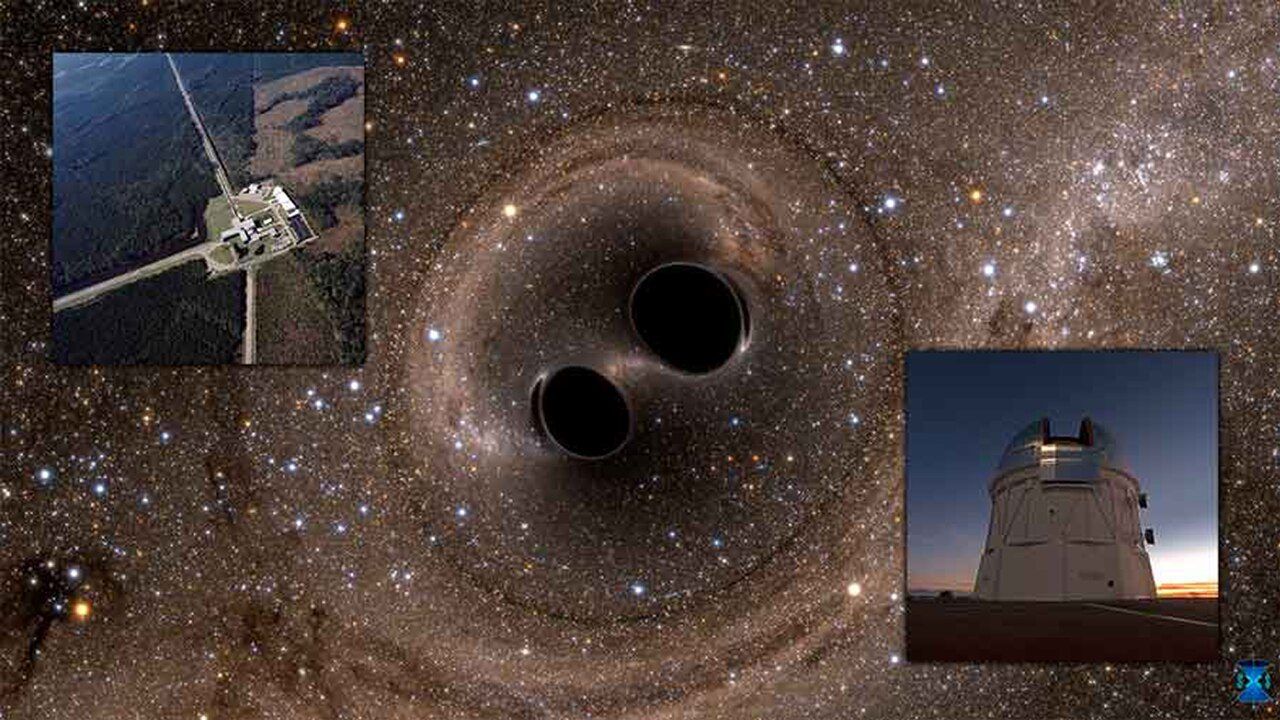
The expected source is pairs of supermassive black holes. Almost every large galaxy has a black hole of millions to billions of solar masses at its centre, and when two galaxies merge their black holes sink to the middle of the new galaxy and orbit each other. A pair of \(10^9\) solar mass black holes separated by a hundredth of a parsec, about 2,000 astronomical units, goes round in a few years and emits gravitational waves at a few nanohertz, in the band of the arrays. There are millions of such pairs in the observable universe, at every stage of their inspiral, and their waves add up to a background with no single direction, which is what the Hellings-Downs curve is built for. The measured amplitude is a little higher than the simplest models of galaxy mergers predicted, which is itself a result about how often galaxies merge and how fast their black holes come together. Other sources, such as processes in the first second after the Big Bang, are possible contributors, and separating them is the next question.
The same physics runs from here to LIGO. The orbital decay of the Hulse-Taylor pulsar at 70 microhertz, the background of supermassive pairs at nanohertz, the planned LISA mission in the millihertz band, and the chirps at a hundred hertz are all the quadrupole formula applied to a pair of masses, and the frequency is set by the masses and the separation. Unit 16 of the masterclass lays out that spectrum as a single figure, derives the timing residual estimate above, states the Hellings-Downs curve with its geometry, and compares it with NANOGrav's binned correlations in a worked example.