

Spacetime Diagrams and the Invariant Interval
Introduces the spacetime diagram of 1908, with events as points, motion as world lines, and light at 45 degrees, and shows how the tilted axes of a moving frame display time dilation, length contraction, and the relativity of simultaneity at a glance. The invariant interval is derived from the Lorentz transformation, the light cone separates cause from effect, the relativistic Doppler effect follows from an exchange of light signals, and the unit separates what a fast-moving object looks like from what is measured.
Unit 4 ended with a combination of time and position, \(c^2t^2 - x^2\), that every inertial frame computes alike, and with the remark that this quantity plays the part that distance plays in ordinary geometry. The remark comes from a lecture that Hermann Minkowski (1864-1909) gave in Cologne on 21 September 1908, three years after Einstein’s paper. Minkowski drew time and space as the two axes of a single plane and showed that the Lorentz transformation is a change of axes in that plane, much as a rotation is a change of axes in a map. The drawing is called a spacetime diagram, and it turns the algebra of Unit 4 into pictures: time dilation, length contraction, the relativity of simultaneity, the reason a cause can never follow its effect, and the change of colour of a moving lamp all become things to see. The last section asks a question the diagrams make precise, namely what a fast object would look like to a camera, and the answer, found in 1959 and first photographed in 2024, is not what fifty years of textbooks had drawn.
1 Events and world lines
The basic object of the diagram is the event, a single happening at one place and one time, such as the tick of a clock, the arrival of a light flash, or the passage of a ship past a buoy. In a frame \(S\) an event has a time \(t\) and a position \(x\); the coordinates \(y\) and \(z\) across the motion are dropped, because the Lorentz transformation leaves them alone. The spacetime diagram of \(S\) plots every event as a point, with the position \(x\) along the horizontal axis and the time along the vertical axis. The time is plotted as \(ct\), the distance light covers in the time \(t\), so that both axes carry the same unit of length. With that choice a light flash moving along the \(x\) axis, which satisfies \(x = ct\), has a horizontal coordinate that always equals its vertical coordinate, so its path runs at exactly \(45\) degrees, and this is the whole reason for the convention. In the diagrams of this unit the axes are marked in metres, and the speed of light is taken as \(300\) m per microsecond, as Unit 4 did, so that \(ct = 300\) m means one microsecond.
A body that lasts for a while is a chain of events, one for every instant of its life, and the chain traces a curve in the diagram called the world line of the body. A body at rest in \(S\) keeps the same \(x\) while \(ct\) grows, so its world line is vertical. A body moving at the constant velocity \(v\) has \(x = vt\), so its world line is a straight line through the origin with \(x = (v/c)\,ct\). The angle \(\alpha\) that this line makes with the vertical axis has the tangent horizontal run over vertical rise, which is \(x\) divided by \(ct\), so that \begin{equation} \tan\alpha = \frac{v}{c} . \label{eq:slope} \end{equation} Light has \(\alpha = 45\) degrees, a slower body has a smaller angle, and since nothing moves faster than light, every world line of a material body is steeper than \(45\) degrees everywhere along its length. A body that speeds up or slows down has a curved world line whose angle with the vertical changes from point to point, but never reaches \(45\) degrees.
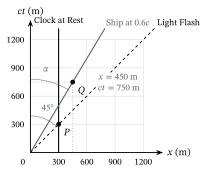
Figure 1 shows three world lines and two events. The clock at rest at \(x = 300\) m has a vertical world line. The ship that leaves the origin at \(0.6c\) has a world line with \(\tan\alpha = 0.6\), an angle of \(31\) degrees from the vertical, and the light flash that leaves the origin at the same moment runs along the diagonal. The event \(P\), where the flash reaches the clock, lies at \(x = 300\) m and \(ct = 300\) m, one microsecond after the start, as it must be for light that covers \(300\) m. The event \(Q\) is the ship passing \(x = 450\) m. Reading its height from the diagram gives \(ct = 750\) m, that is, \(2.5\) microseconds, and \(450\) m in \(2.5\) microseconds is \(180\) m per microsecond, which is \(0.6c\), so the diagram and the arithmetic agree. So far the diagram is only a graph of position against time with the axes exchanged; what is new is what happens when a second frame is drawn into the same picture.